In step 1 you can visualise the coverage area, the cross section and the map of the model unit, and also the lithology and the synthetic borehole.
Lithology and interpretations
The visualisation shows the interpretation of the hydrogeological units (left-hand column), the record of the lithoclasses, the vertical sequence of the layers in the lithology, and in addition the horizontal and vertical hydraulic conductivity classes of the hydrogeological model units. Hydraulic conductivity classes are only shown if these data have been used for the maps of the hydraulic conductivity.
The synthetic borehole
The synthetic borehole shows the vertical sequence of the model units at a chosen location in relation to the ground level. The record provides insight into the depth, thickness and hydraulic properties of these units, namely the horizontal hydraulic conductivity (kh), the vertical hydraulic conductivity (kv), the transmissivity (kD) and the hydraulic resistance (c).
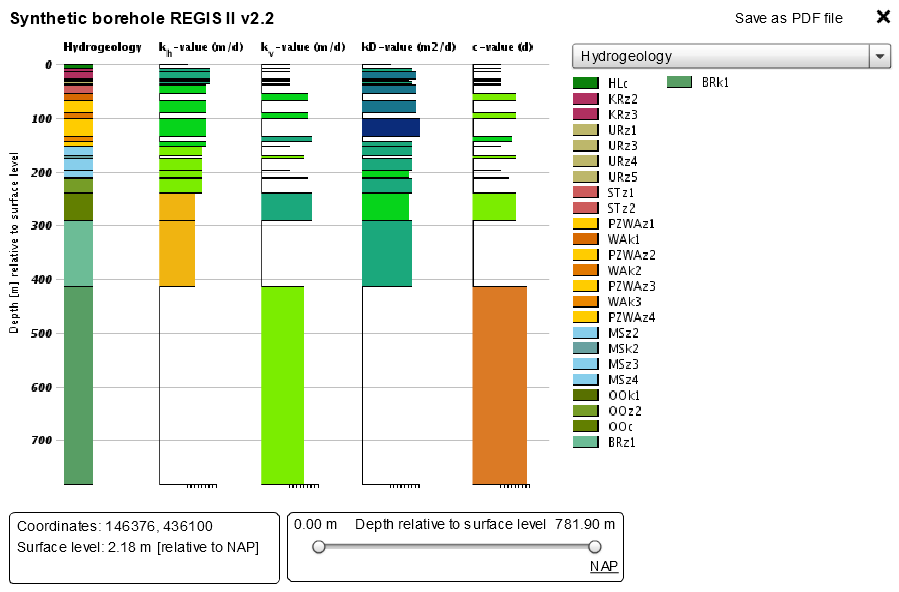
Example of a synthetic borehole in REGIS II
Caveats
Some aspects of the REGIS II-model need to be borne in mind when using the model. These “caveats” have been compiled in a shapefile and a document (in Dutch) with additional information. These files are updated when necessary. Both files are available in a zip file that you can select when making your order. You can also download the document here.
Viewing the model on your own computer
Request the model data so you can view REGIS II in the SubsurfaceViewer and in ArcGIS on your own computer.
The grids available for each model unit in REGIS II provide information on the distribution, depth, thickness and hydraulic properties of the unit. These files enable users to analyse and combine the REGIS II data with their own GIS data. The ArcGISfiles have been compiled in one zip file containing the following files and documents:
- ArcMap document "REGIS II v2.2.3.mxd", which includes all model units”. All model units of a stratigraphical unit are grouped in the same Group Layer.
- Per unit:
- A shapefile (points) of the borehole logs coupled with a hydrogeological interpretation that provides information on the top, base and thickness of the unit (restricted to the poorly permeable units, the “complexe eenheden” (complex units) and the “kalksteen eenheden” (chalk units)).
- A shapefile (points) of the borehole logs coupled with a hydrogeological interpretation in which the unit is not present (restricted to the poorly permeable units, the “complexe eenheden” (complex units) and the “kalksteen eenheden” (chalk units)).
- A shapefile (points) of the upscaled horizontal hydraulic conductivity (restricted to the permeable units and the “complexe eenheden” (complex units)) or upscaled vertical hydraulic conductivity (restricted to the poorly permeable units and the “complexe eenheden” (complex units)) at the borehole scale.
- Shapefile (line) with the faults with an offset in the unit (restricted to the poorly permeable units, the “complexe eenheden” (complex units) and the “kalksteen eenheden” (chalk units)).
- Shapefile (polygon) with the outline of the area mapped (restricted to units that were only partially mapped).
- Grid maps of the depths to the top and the base of the unit (in m relative to NAP).
- Grid map of the thickness of the unit (in m).
- Grid maps with uncertainties of the top, thickness and base (in m, only for resistant and complex units).
- Grid maps of the horizontal hydraulic conductivity and the standard deviation of the horizontal hydraulic conductivity (in m/d, restricted to the permeable units and the “complexe eenheden” (complex units)).
- Grid maps of the vertical hydraulic conductivity and the standard deviation of the vertical hydraulic conductivity (in m/d, restricted to the poorly permeable units and the “complexe eenheden” (complex units)).
- Grid map of the transmissivity of the unit (in m2/d, restricted to the permeable units, the “complexe eenheden” (complex units) and the “kalksteen eenheden” (chalk units)).
- Grid map of the hydraulic resistance of the unit (in d, restricted to the poorly permeable units and the “complexe eenheden” (complex units)).
- General information that supports the use of the model:
- Outline of the coverage area of REGIS II.
- Outline of the topographic map sheets. The numbering of the borehole logs has been based on these map sheets (shapefile, polygon).
- Grid map of the ground surface elevation (in m relative to NAP) used as upper boundary of the model.
- Grid map of the phreatic level (in m relative to NAP) used to calculate the saturated thickness of the permeable units, the “complexe eenheden” (complex units) and the “kalksteen eenheden” (chalk units).
- The “BRT Achtergrondkaart” of Kadaster (The Netherlands’ Cadastre, Land Registry and Mapping Agency) as topographical map of the Netherlands (via a Web Map Service).
Limitations of ArcGIS
In some parts of the Netherlands a few units of REGIS II are outside the depth range of the model. In those areas the units have not been mapped.
The ArcMAP documents can only be opened in ArcGIS version 10.8.1 or higher. The grid files and shapefiles can be opened in most of the GIS applications, though sometimes they must first be converted.
View models in 3D on your own computer
With the BRO 3D web services, you can easily include REGIS II in your own GIS environment. REGIS II is offered as a 3D Object Scene Layer (bèta version). These Scene Layers are available with both RD and WGS coordinates. Read more about the various features and functionalities of the BRO 3D web services and REGIS II on the portal.