DINOloket is a map application that provides access to the largest database on the Dutch subsurface. On this page you will find instructions on how to use this application. This page is entirely about the use of the map for subsurface models. If you want to read the instructions for using the map for subsurface data, then use the Help button (left) on the map for Subsurface Data. For the old version, this Help page Subsurface Data is still applicable.
How to navigate on the map
Zoom in/Zoom out
Scroll with your mouse to zoom in and out of the map.
You can also use the navigation buttons:
 Zoom in
![]() Zoom out
Zoom out
 Zoom out completely
Move around/pan
To move the map, click and hold the mouse button and then move the mouse. You can then move the map to navigate to the desired location.
Search location
 By clicking on the search button, you can search for a location or object on the map.
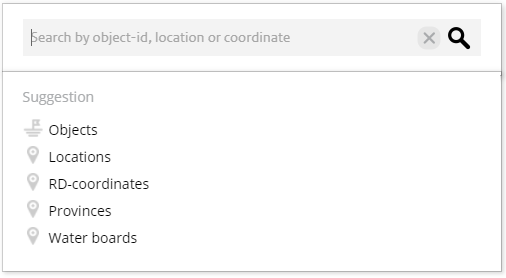
A window will then appear in which you can search in the following categories:
- Object (via identification)
- This allows you to search for a specific object by entering the identification number.
- Address
- This allows you to search for an address in the Netherlands. This can also be a zip code or the name of a city. As you enter the address, suggestions will be given to help you find the right location.
- RD-coordinates
- This allows you to search by RD (National Triangulation System) coordinates.
- Province
- You can search for provinces or you can select one of the provinces in the Netherlands by clicking on Provinces. The selected province will be outlined on the map.
- Water board
- You can search for water boards or you can select one of the water boards in the Netherlands by clicking on Water boards. The selected water board will be outlined on the map.
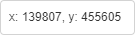
RD Coordinates
In the right bottom corner of the map the RD coordinates of the position of the mouse are displayed.
Show and hide data on the map
When you open the interactive map, no data is shown on the map. This is because no map layers have been selected yet. At the top left you will find an overview of the available models.
By selecting one model the data will be shown on the map.
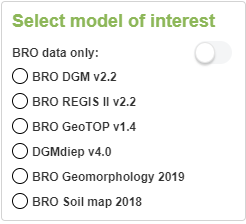
By activating the "BRO data only" button, only the map layers with BRO data will be shown. By default, all map layers are available.
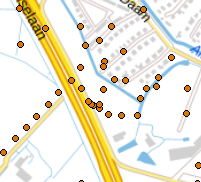
View object information
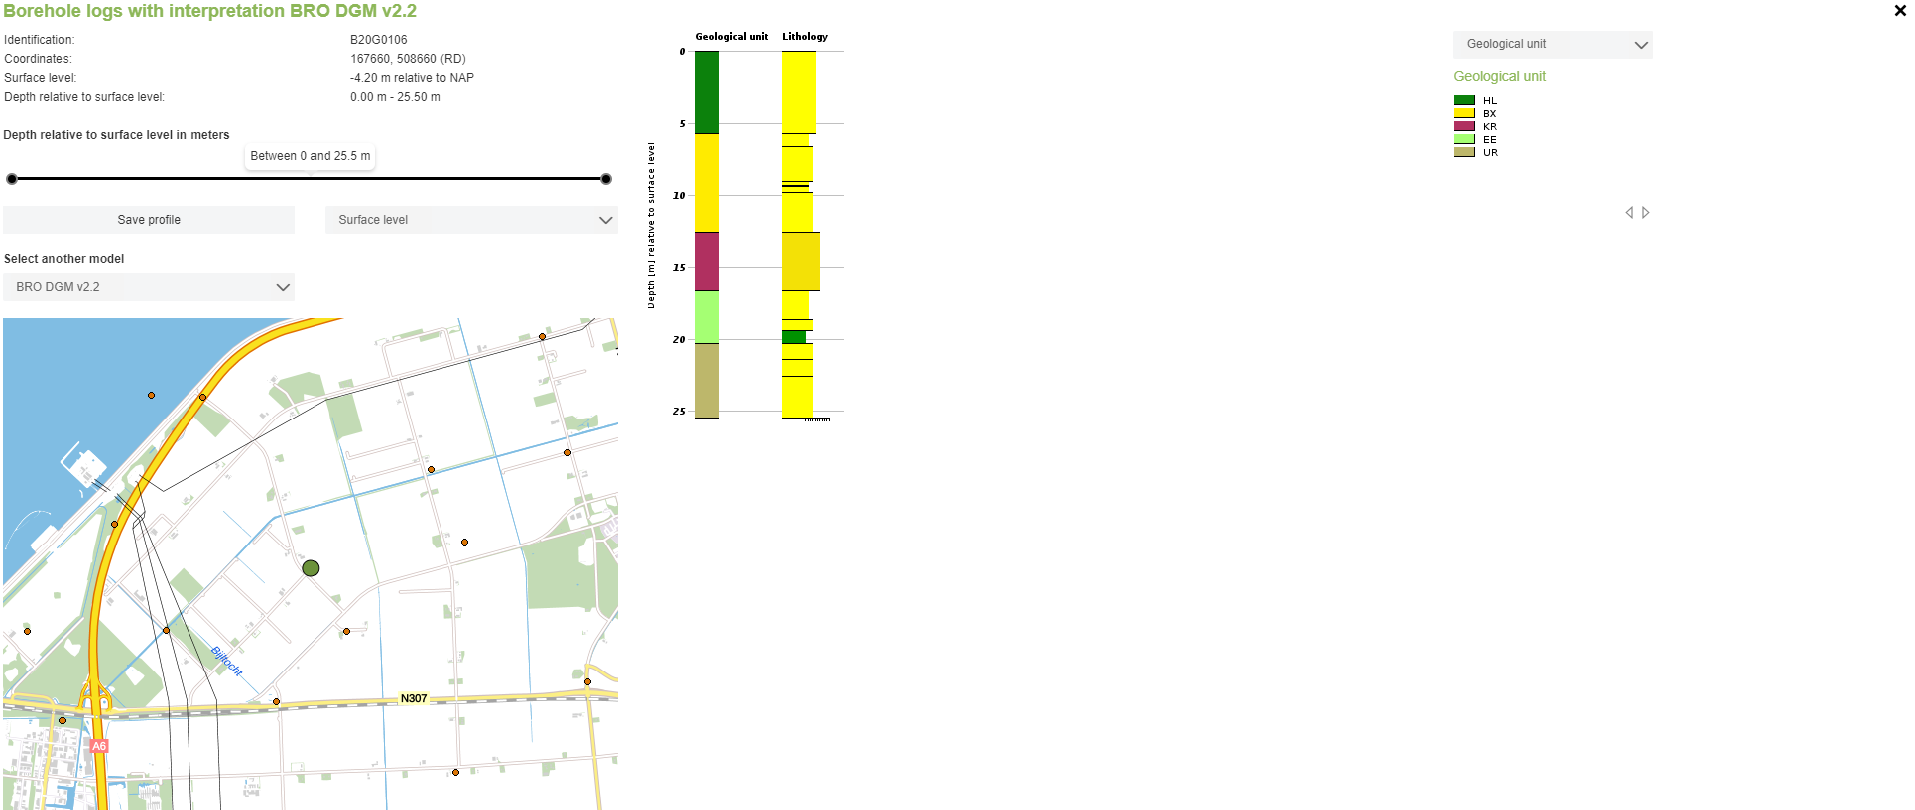
By clicking on one of the objects on the map, a window is opened with information about the object.
In the pop-up window, data of the object is shown.
In addition to basic information about the selected object, a profile is also displayed on the screen. The data shown in the profile may differ per model. A few more standard display options can also be adjusted in the screen. For example, the slider allows the information to be limited to a specific depth range.
It is also possible to switch model directly from the information screen.
When multiple objects are close to each other on the map, multiple points can be displayed in the object information screen with a click action. The arrows in the information screen can be used to click through to adjacent objects.
Using the "Save profile" button, the current view can be downloaded as a PDF.
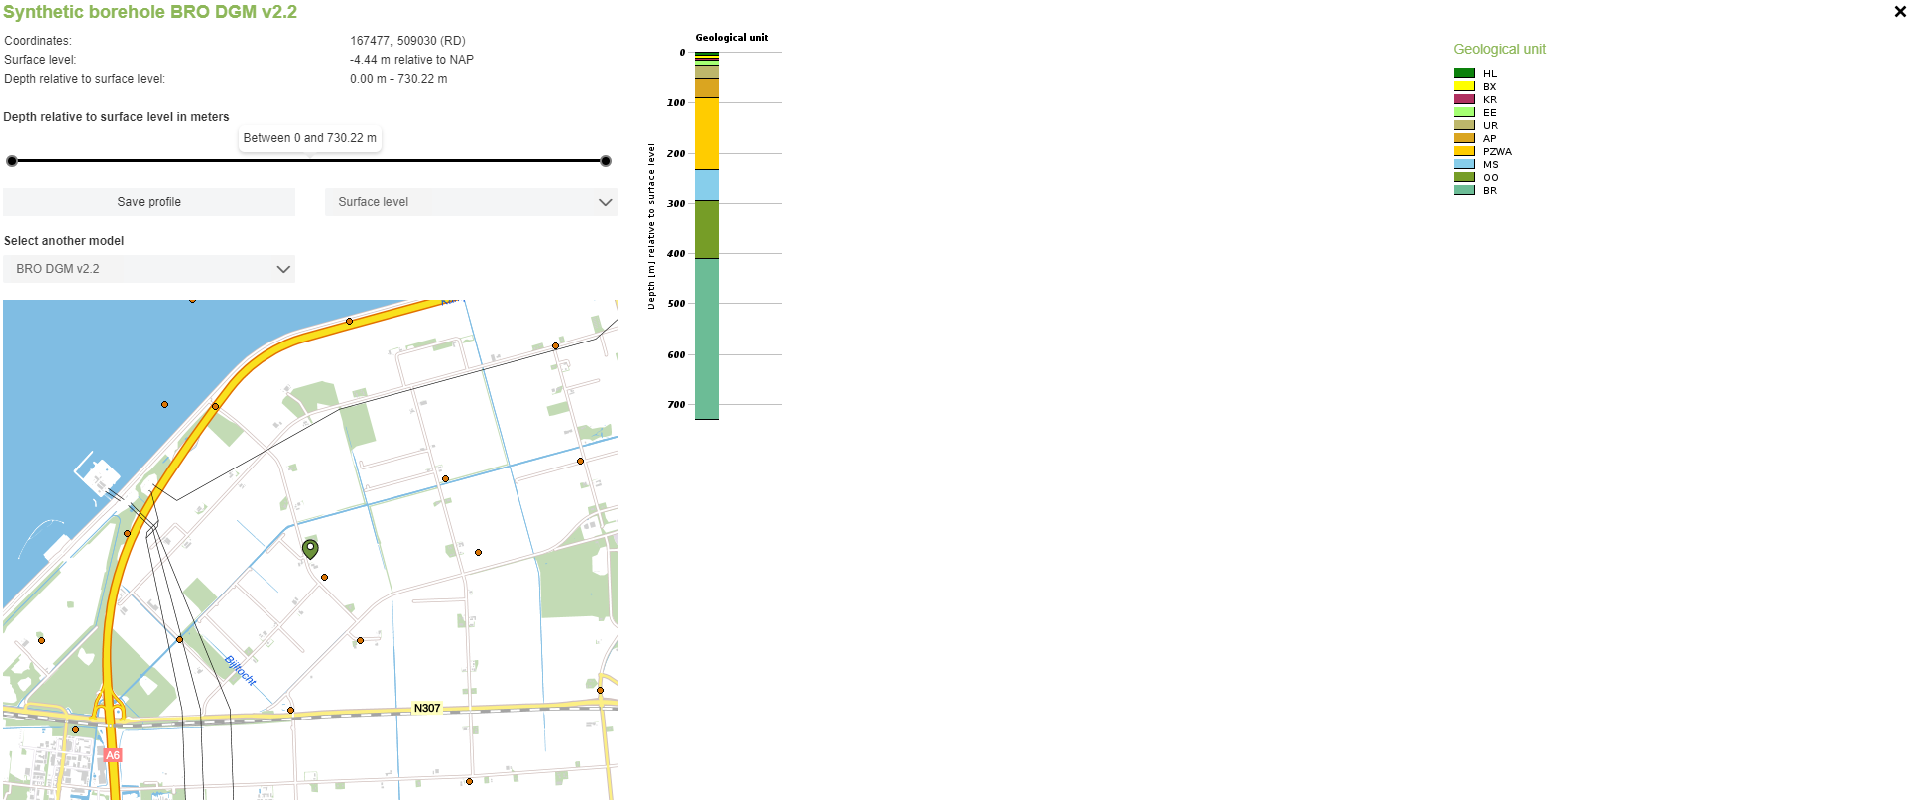
Synthetic borehole
![]() By clicking on the button with the synthetic borehole symbol, you can activate or deactivate the selection tool. After clicking on the desired location on the map, a screen with generated point information follows.
By clicking on the button with the synthetic borehole symbol, you can activate or deactivate the selection tool. After clicking on the desired location on the map, a screen with generated point information follows.
In addition to basic information about the selected location, a profile is also displayed on the screen. The data shown in the profile may differ per model. A few more standard display options can also be adjusted in the screen. For example, the slider allows the information to be limited to a specific depth range.
Using the button "Save profile", the current view can be downloaded as a PDF.
Crossection information
With the help of the cross-section tool it is possible to make a vertical cross-section of the substrate model. A cross-section needs to have a minimum length of 1 km and a maximum of 350 km long.
![]() By clicking on the button with the cross-section symbol, you can activate or deactivate the selection tool. Click on a desired location on the map to determine a starting point.
By clicking on the button with the cross-section symbol, you can activate or deactivate the selection tool. Click on a desired location on the map to determine a starting point.
You can then add multiple points to the cross-section with a new click on the map. By clicking on a registered bore, the bore will also be included in the result. You end the cross-section by double-clicking on the desired end point. A selection option is then shown to delete the line or to show the section.
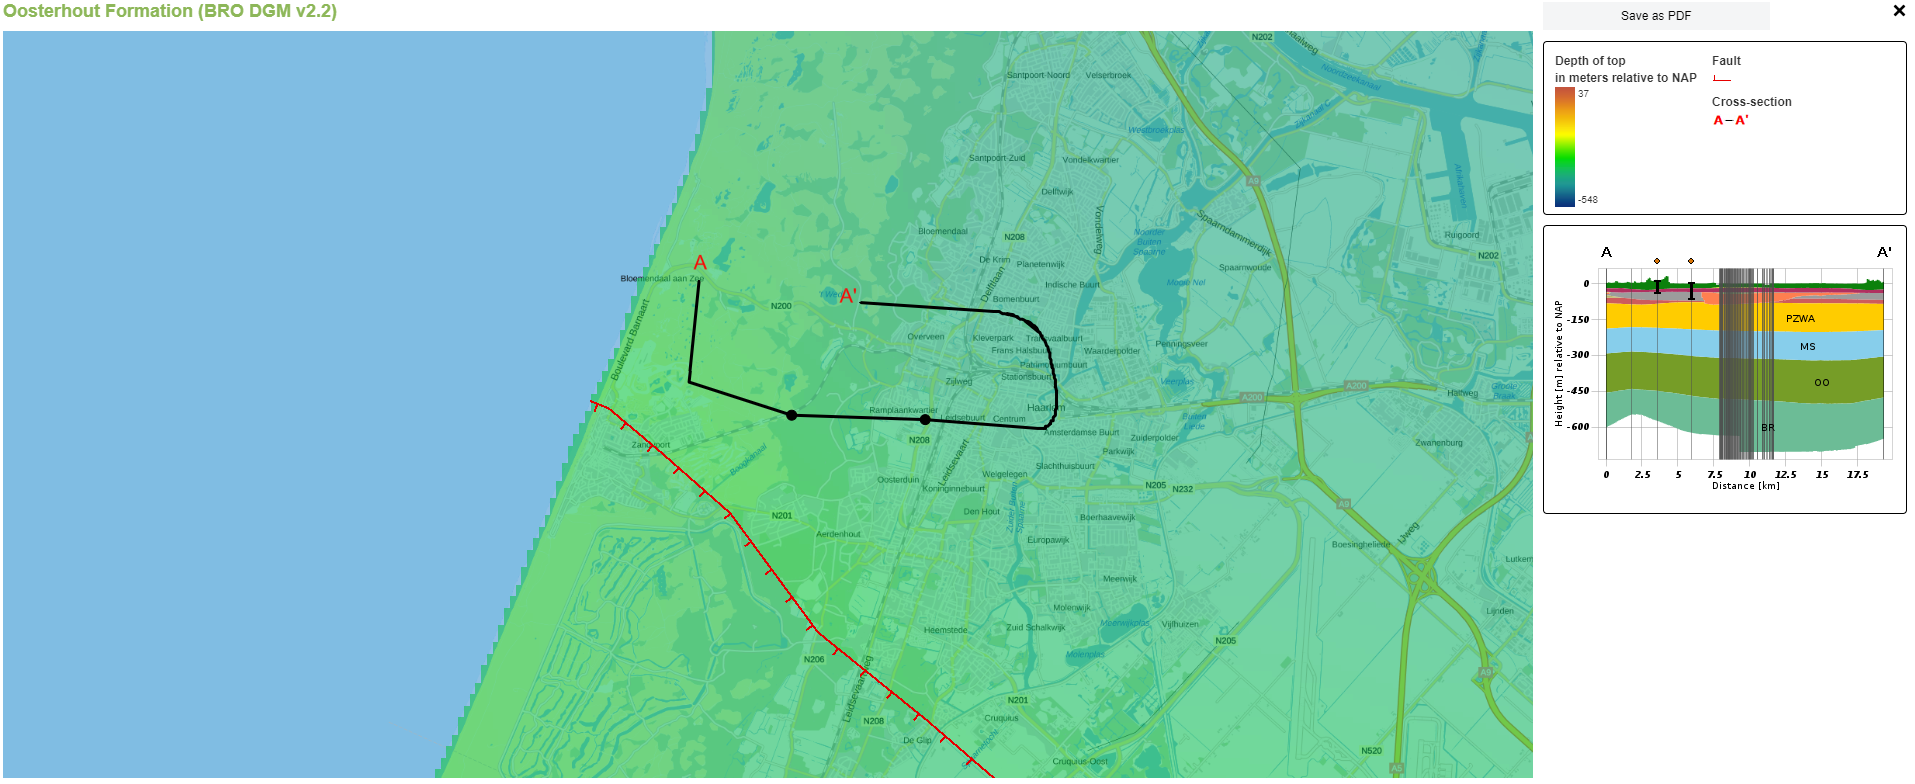
The result of the cross-section will be displayed on the screen. The cross-section shown naturally depends on the chosen location and the selected model. If you selected boreholes when creating the cross-section, these will be shown in the result with vertical lines.
In the screen, the information can be limited to a specific depth range via the scroll bar. In addition, it is also possible to change models directly from the information screen.
Using the button "Save as PDF", the current view can be downloaded as PDF.
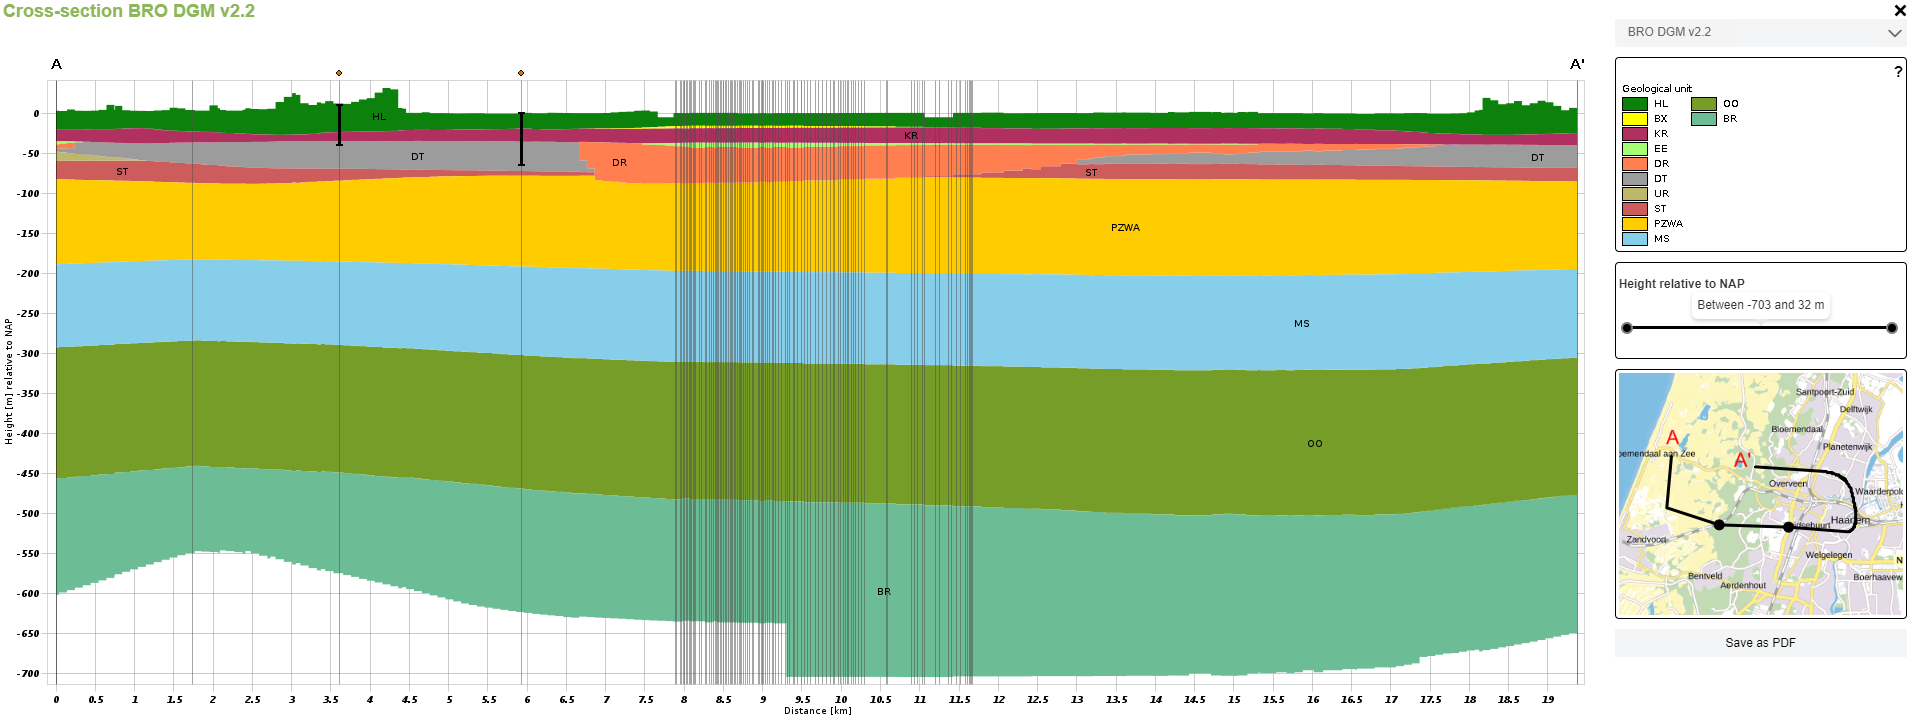
To get more information about a specific layer, you can move your mouse over this layer. A window will then appear with additional information and available links to view the cross-section in a different perspective.
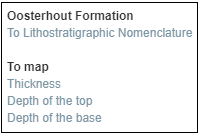
With the help of the cross in the top right you can return to the previous screen.
Request data models
![]() The DINOloket also offers complete data models for download. By clicking on the button with the download symbol, you can start the request. After this an overview appears with different types of files. After selecting a file type you can select which specific files you are interested in.
The DINOloket also offers complete data models for download. By clicking on the button with the download symbol, you can start the request. After this an overview appears with different types of files. After selecting a file type you can select which specific files you are interested in.
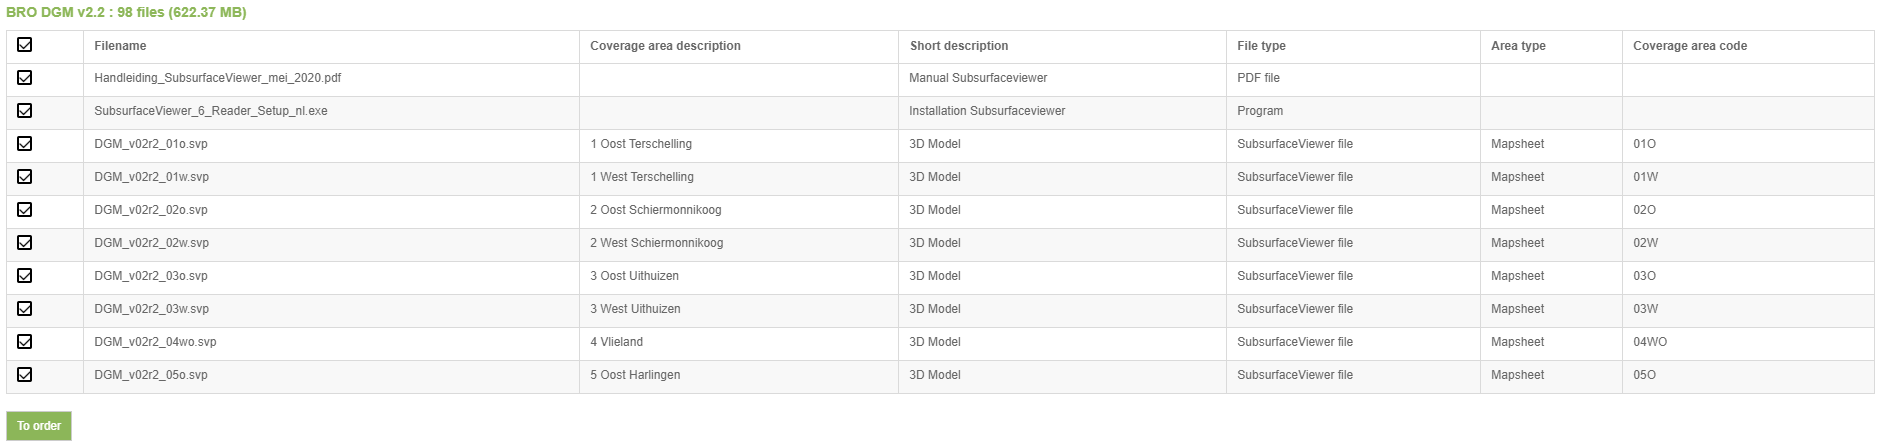
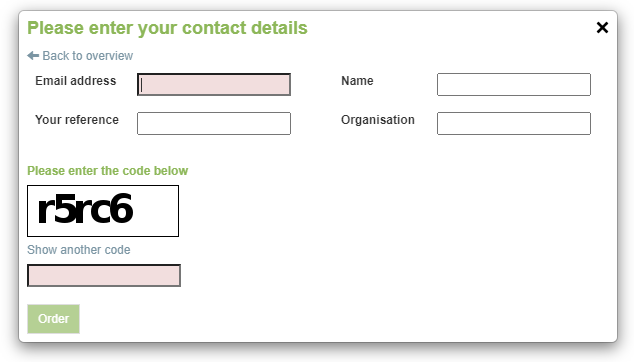
If you are satisfied with the selection made, click on the button "Go to Order". A form will then appear where you can enter the following information:
- Email address (required)
- The e-mail address used to send the order.
- Name
- The name used in the e-mail header.
- Feature
- An attribute is used as a subject in the e-mail, among other things. You can easily recognize the order.
- Organization
- The organization for which you request the information.
- Control code
- You must copy the displayed (CAPTCHA) code. This way we try to prevent abuse.
(The data entered will only be used to send the requested data by e-mail. View the terms of use and privacy to use the website)
After submitting the data, your order will be processed. The possible processing time can be up to a maximum of 4 hours. Once your order has been processed, you will receive an email with a link to the download location. You can then download the data in .ZIP format.
Did you not receive the e-mail within the specified period of 4 hours? Then try again or contact the DINOloket service desk.