In step 1 you can visualise the spatial extent of GeoTOP, maps of the geological units and also the real and synthetic borehole logs.
Borehole logs and interpretations
The visualisation shows the interpreted intervals of the model unit (left-hand column), the interpreted intervals of the lithological classes (centre column) and the vertical sequence of the intervals of the borehole log (right-hand column).
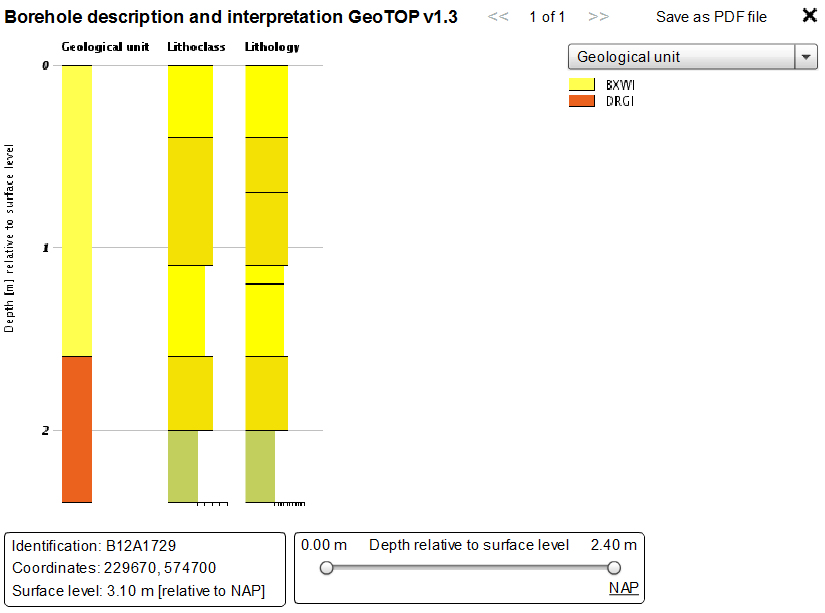
Example of a visualisation of a borehole log used in the GeoTOP model
Synthetic borehole
The synthetic borehole through the GeoTOP voxel model shows the vertical sequence of the voxels at a selected location on the map. The voxels measure 100 by 100 by 0.5 m (x, y, z) and therefore correspond to synthetic borehole intervals with a thickness of 50 cm. Per voxel, the following properties are displayed that are representative for the entire voxel:
- The geological unit to which the voxel belongs (left-hand column);
- The model uncertainty of the geological unit – that is the degree to which the model gives an unambiguous estimate of the geological unit to which the voxel belongs;
- The most probable lithological class assigned to the voxel;
- The probability of occurrence of the lithological classes in each voxel (right-hand column).
Uncertainties
In GeoTOP the lithological classes are estimated in a stochastic procedure that in addition to estimating the most probable lithological class also estimates the probability of occurrence of each of the discerned lithological classes. The probabilities are a measure of the model uncertainty. For example, if 80% fine sand and 20% clay have been predicted, the uncertainty is relatively low. If, on the other hand, a probability of 35% clay, 40% peat and 25% fine sand has been predicted, then the uncertainty is relatively high. It is important to realise that probabilities are not the same as proportions: a 35% probability of the occurrence of clay means that the entire voxel has a probability of being filled with clay and not that 35% of the voxel contains clay.
The subdivision into model units is also linked with uncertainties but these are not displayed in the synthetic borehole. The ArcGIS files of the GeoTOP layer model do contain information about the uncertainty of the model units. From version v1.6.1, the model uncertainty of geological unit has been improved. The explanation describes the improvement.
GeoTOP versions subsequent to version v1.2 contain two new indicators of model uncertainties:
- Model uncertainty of the geological unit: the degree to which the model gives an unambiguous estimate of the geological unit to which the voxel belongs.
- Model uncertainty of the lithological class: the extent to which the model gives an unambiguous estimate of the lithological class that is representative for the voxel.
In both cases the model uncertainty is expressed by a digit in a range from 0 to 1. A very low model uncertainty is expressed by 0 (the model gives an unambiguous estimate); a very high uncertainty is expressed by 1 (the model is unable to give an unambiguous estimate).
Cross section
After opting to display a cross section in GeoTOP you can select the attributes of the voxel model to be shown: model unit, lithological class, probability of occurrence of a lithological class, model uncertainty of the lithological class or model uncertainty of the geological unit.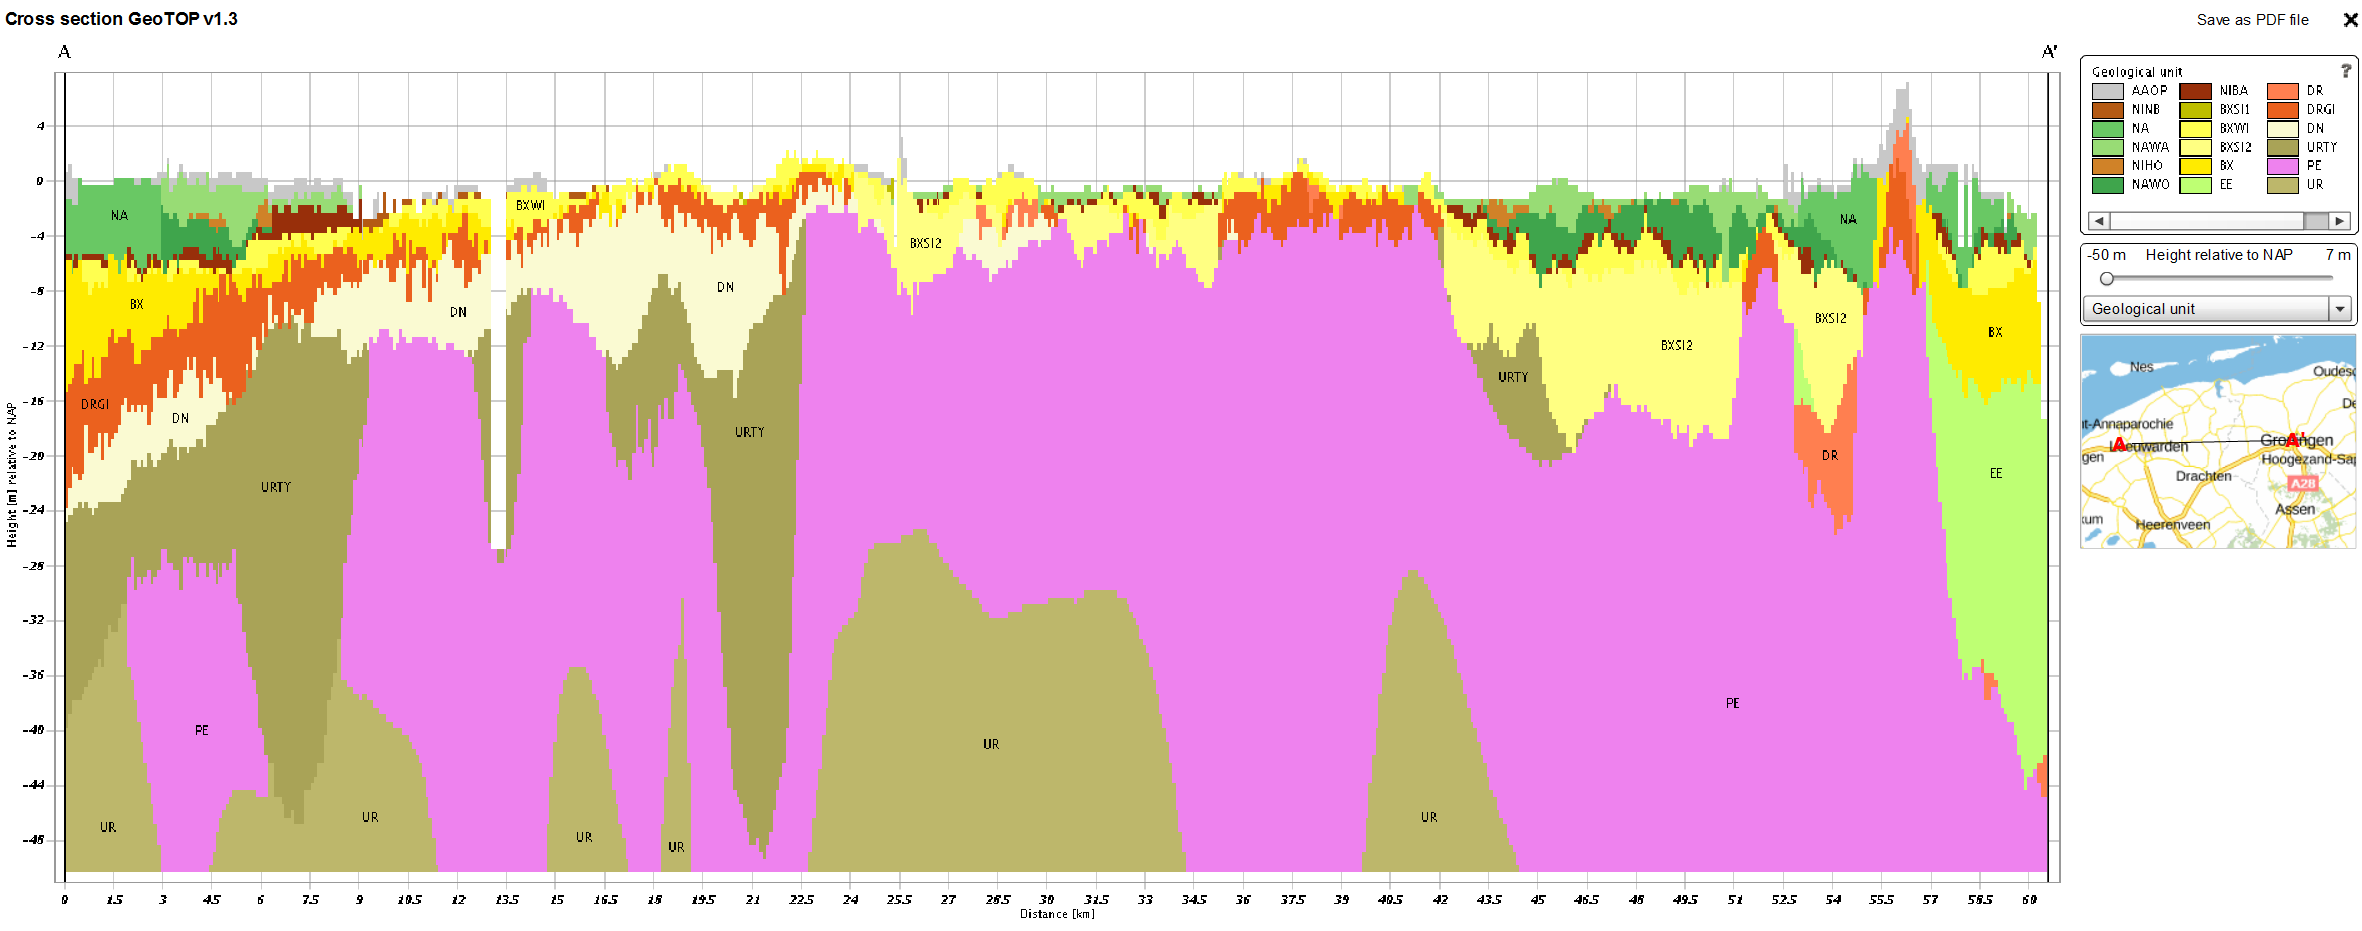
Example of a cross section through the GeoTOP model showing attributes you can select
Viewing the model on your own computer
You can view the requested GeoTOP model data on your own computer in the SubsurfaceViewer and in ArcGIS. ArcGIS applications are available as grid files of the top, base and thickness of the model units in the layer model, and as grid files of horizontal sections through the voxel model (both relative to ground level and to NAP). The content of both datasets is described below.
Five ArcGIS grid files are available for each GeoTOP model unit: top, base, thickness, standard deviation of the top and standard deviation of the base. In the current version of GeoTOP the grid files of the separate versions of the model areas are combined. One possible use of the grid files is to develop a framework of a detailed local scale subsurface model, such as a building site.
ArcGIS files of the layer model
The ArcGIS files are compiled in one zip file of c. 4,5 GB. The unzipped files cover about 55 GB. The zip file contains the following files:
- ArcMap document “Holoceen” of the Holocene units supplied with legends.
- ArcMap document “Pleistoceen” of the Pleistocene and older units supplied with legends.
- Per unit:
- Grid maps of the distribution and depth of the top and the base of the unit (in m relative to NAP).
- Grid maps of the distribution and thickness of the unit (in m).
- Grid maps of the standard deviations of the depths to the top and base of the unit (in m).
- Shapefile (points) of the interpreted borehole logs that comprise the unit, supplied with information on the top, base and thickness of the unit in the borehole log.
- General information that supports the use of the model:
- Schematic topographic map of the Netherlands (shapefile, polygon).
- Boundaries of the GeoTOP model areas (shapefile, polygon).
- Digital Terrain Model (grid file).
- Outline of the topographic map sheets. The numbering of the borehole logs has been based on these map sheets (shapefile, polygon).
ArcGIS files with depth slices of the voxel model
Horizontal slices (grid files) provide insight into the spatial distribution of the model units and lithological classes at a specific elevation or depth relative to NAP or to surface level. A zip file with horizontal slices comprises the following files:
- ArcMap document of the compiled maps, with legends.
- Per depth, at 50 cm intervals:
- Grid file of the lithological class of the model unit (NB: the ArcMap document only shows the grids for 1 m intervals; the download files contain all grids per 50 cm interval).
- General information that supports the use of the model:
- Schematic topographic map of the Netherlands (shapefile, polygon).
- Boundaries of the GeoTOP model areas (shapefile, polygon).
- Digital Terrain Model (grid file).
- Outline of the topographic map sheets. The numbering of the borehole logs has been based on these map sheets (shapefile, polygon).
The file names of the horizontal slices are composed from the following codes:
- Horizontal slices relative to surface level: the name has a prefix “strat” (model units) or “lith” (lithological class), followed by the depth in cm below ground level (4 digits). For example: strat_0000_mv.img means a slice through the model units to a depth of 0 to 0.5 m below surface level. The next grid strat_0050_mv.img provides the slice at a depth of 0.5 to 1 m below ground level.
- Horizontal slices relative to NAP: the name has a prefix “strat” (model units) or “lith” (lithological class) followed by a serial number of 3 digits and the depth in cm relative to NAP (4 digits). Serial number 001 is the lowest slice at 50 m below NAP and it shows the interval from 50 to 49.50 m below NAP. The name is as follows: lith_001_5000_cm_onder_nap.img. An example of a slice above NAP is lith_103_0100_cm_boven_nap.img, showing the range of 1 to 1.5 m above NAP.
Limitations of ArcGIS
As the grids of several model areas have been merged, some artificial transitions may be visible along the boundaries of the model areas.
Some units may fall within the depth range of GeoTOP in one model area, but may fall outside the depth range in another model area. These units are modelled only in those model areas where the units fall within te depth range of GeoTOP.
The user can open the files in ArcGIS version 10.8.1 or higher. Files in a lower version (9.2 or 9.3) can be requested via the contact form. Grid files and shapefiles can be opened in nearly all GIS applications, though sometimes they must first be converted. Examples of alternative GIS packages are Grass (open-source), MapInfo and GeoMedia.
View models in 3D on your own computer
With the BRO 3D web services, you can easily include GeoTOP in your own GIS environment. GeoTOP is offered both as a Voxel Scene Layer and as a 3D Object Scene Layer. In order not to overload your browser and computer unnecessarily, Scene Layers are also offered per model area. Almost all Scene Layers are available with both RD and WGS coordinates. Read more about the various features and functionalities of the BRO 3D web services and GeoTOP on the portal.