The bottom of the North Sea plays an important role as a habitat for animals and plants. Moreover, many human interventions take place on and in it. It is important to visualize this underwater bottom as accurately as possible. The old hand-drawn map, in use for more than 20 years, has been replaced by a grid model, calculated with machine learning. This model can be used for habitat-suitability analyses, in planning shallow interventions such as sand extraction and cable and pipeline construction, and to investigate the propagation of underwater noise.
The new seabed-sediment map shows which sediment class typifies the top half meter of the seabed. The user can choose between three classification systems based on the ratio of mud (< 63 µm), sand (63-2000 µm) and gravel (> 2000 µm): Folk 16, Folk 7 and Folk 5 (Kaskela et al. 2019).
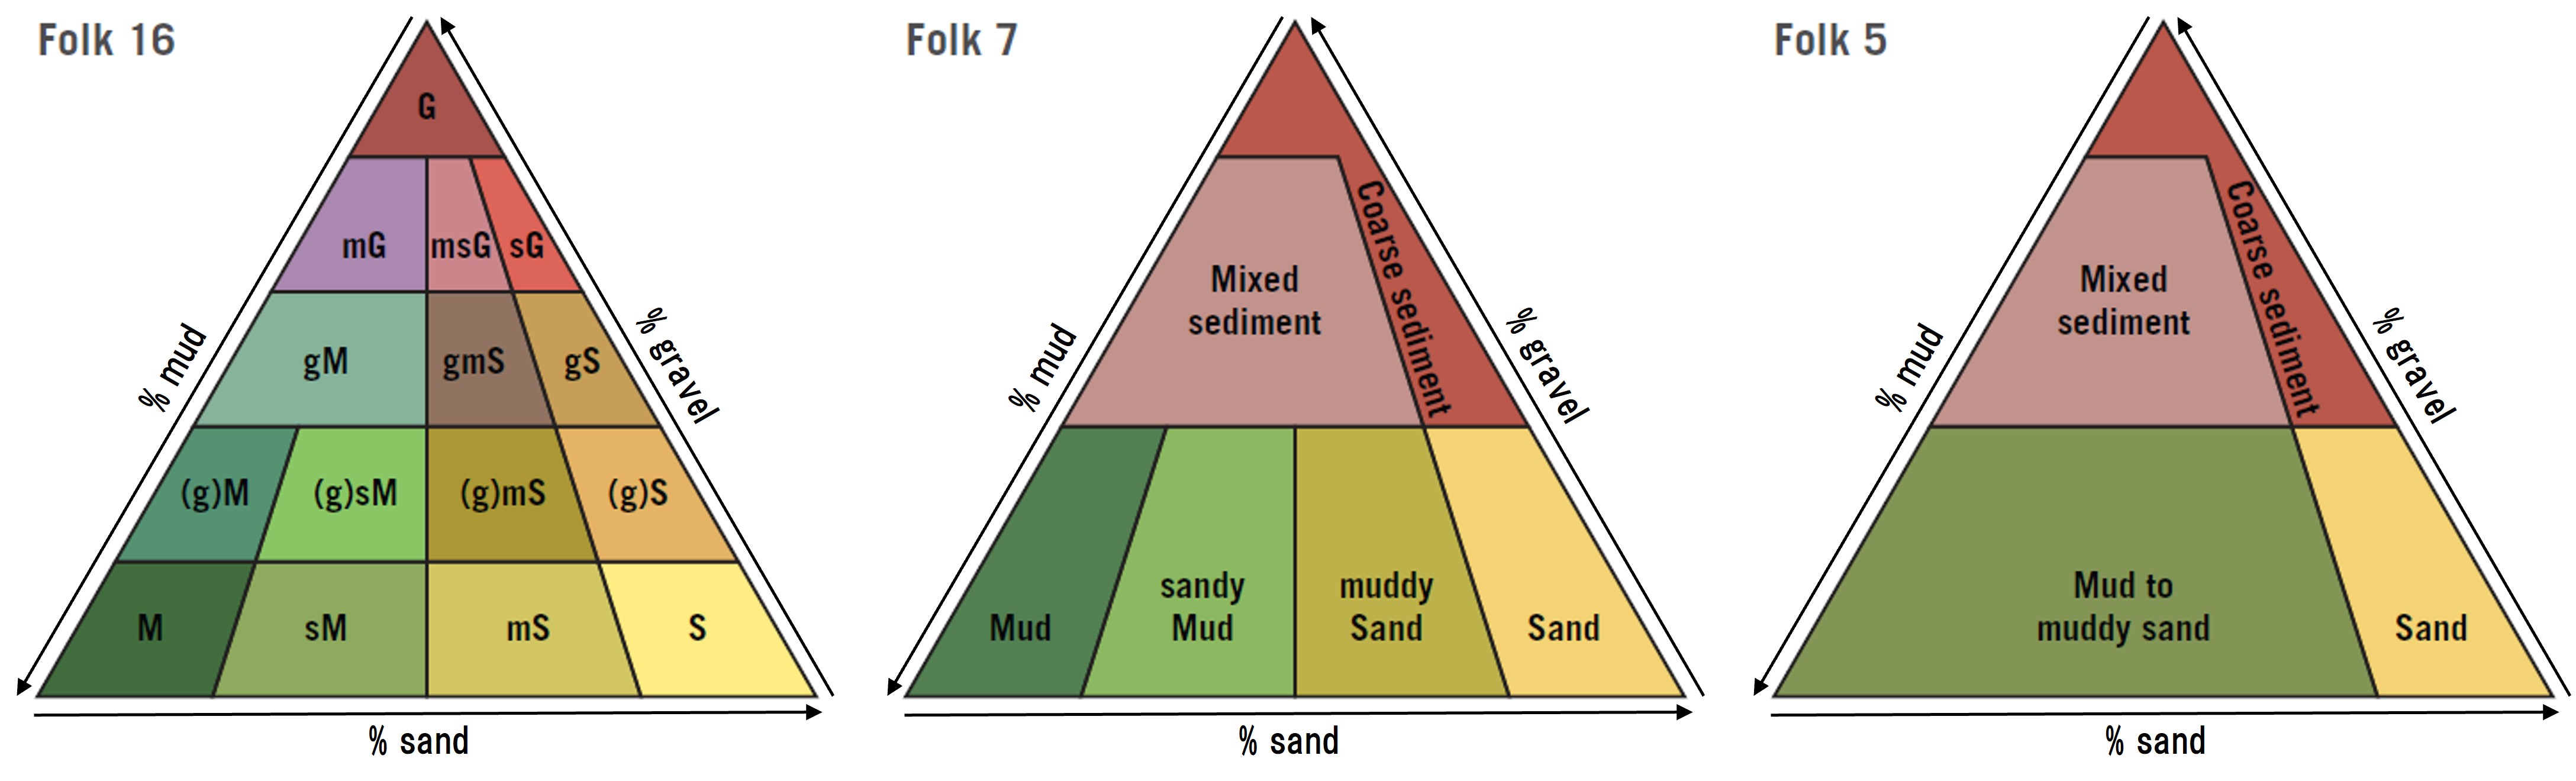 Folk classifications and color codes.
Folk 16 refers to the complete classification of sediment as developed by the American sedimentologist Robert Folk (1954), supplemented by a category that encompasses all sediment classes coarser than gravel – cobbles and boulders – as well as in situ rock. This is the international standard. Folk 7 merges a number of sediment types and is especially suitable when a simplified representation of the entire Dutch North Sea bed is needed. Folk 5 is consistent with the European Union Nature Information System (EUNIS), a harmonized classification of European habitat types. For each map, the probability of the predicted class is visualized as well. This attribute is important when a map view is used to make decisions. Five uncertainty classes represent both numerically and textually how certain we are of our prediction.
A living map
Replacement of hand-drawn maps is expensive and therefore rarely happens. In contrast, the new model can be adapted quickly and cheaply. Because of the importance of the North Sea for our safety and for the energy transition, the supply of new data – sample analyses and bathymetric measurements – is large. Every user will be able to benefit from regular updates as the dataset grows. Public data provided by users and other stakeholders will be incorporated into these maps once a year. Instead of one static, outdated map, the Geological Survey of the Netherlands now shows several map views that reflect the latest state of affairs: we have become flexible and thus more customer-oriented. An additional advantage: the grid format makes integration into decision-support systems easier than before.
Users will need some time getting used to the new map views. The simple, flowing pattern of the old, hand-drawn map has been replaced by a higher-resolution but speckly representation in which areas with a particular sediment type can be very small. Once users are accustomed to this visual change, a brand-new generation of seabed-sediment maps can be applied to its full capability. The relationship between large-scale bedforms and seabed-sediment type, for example, is more noticeable than before.
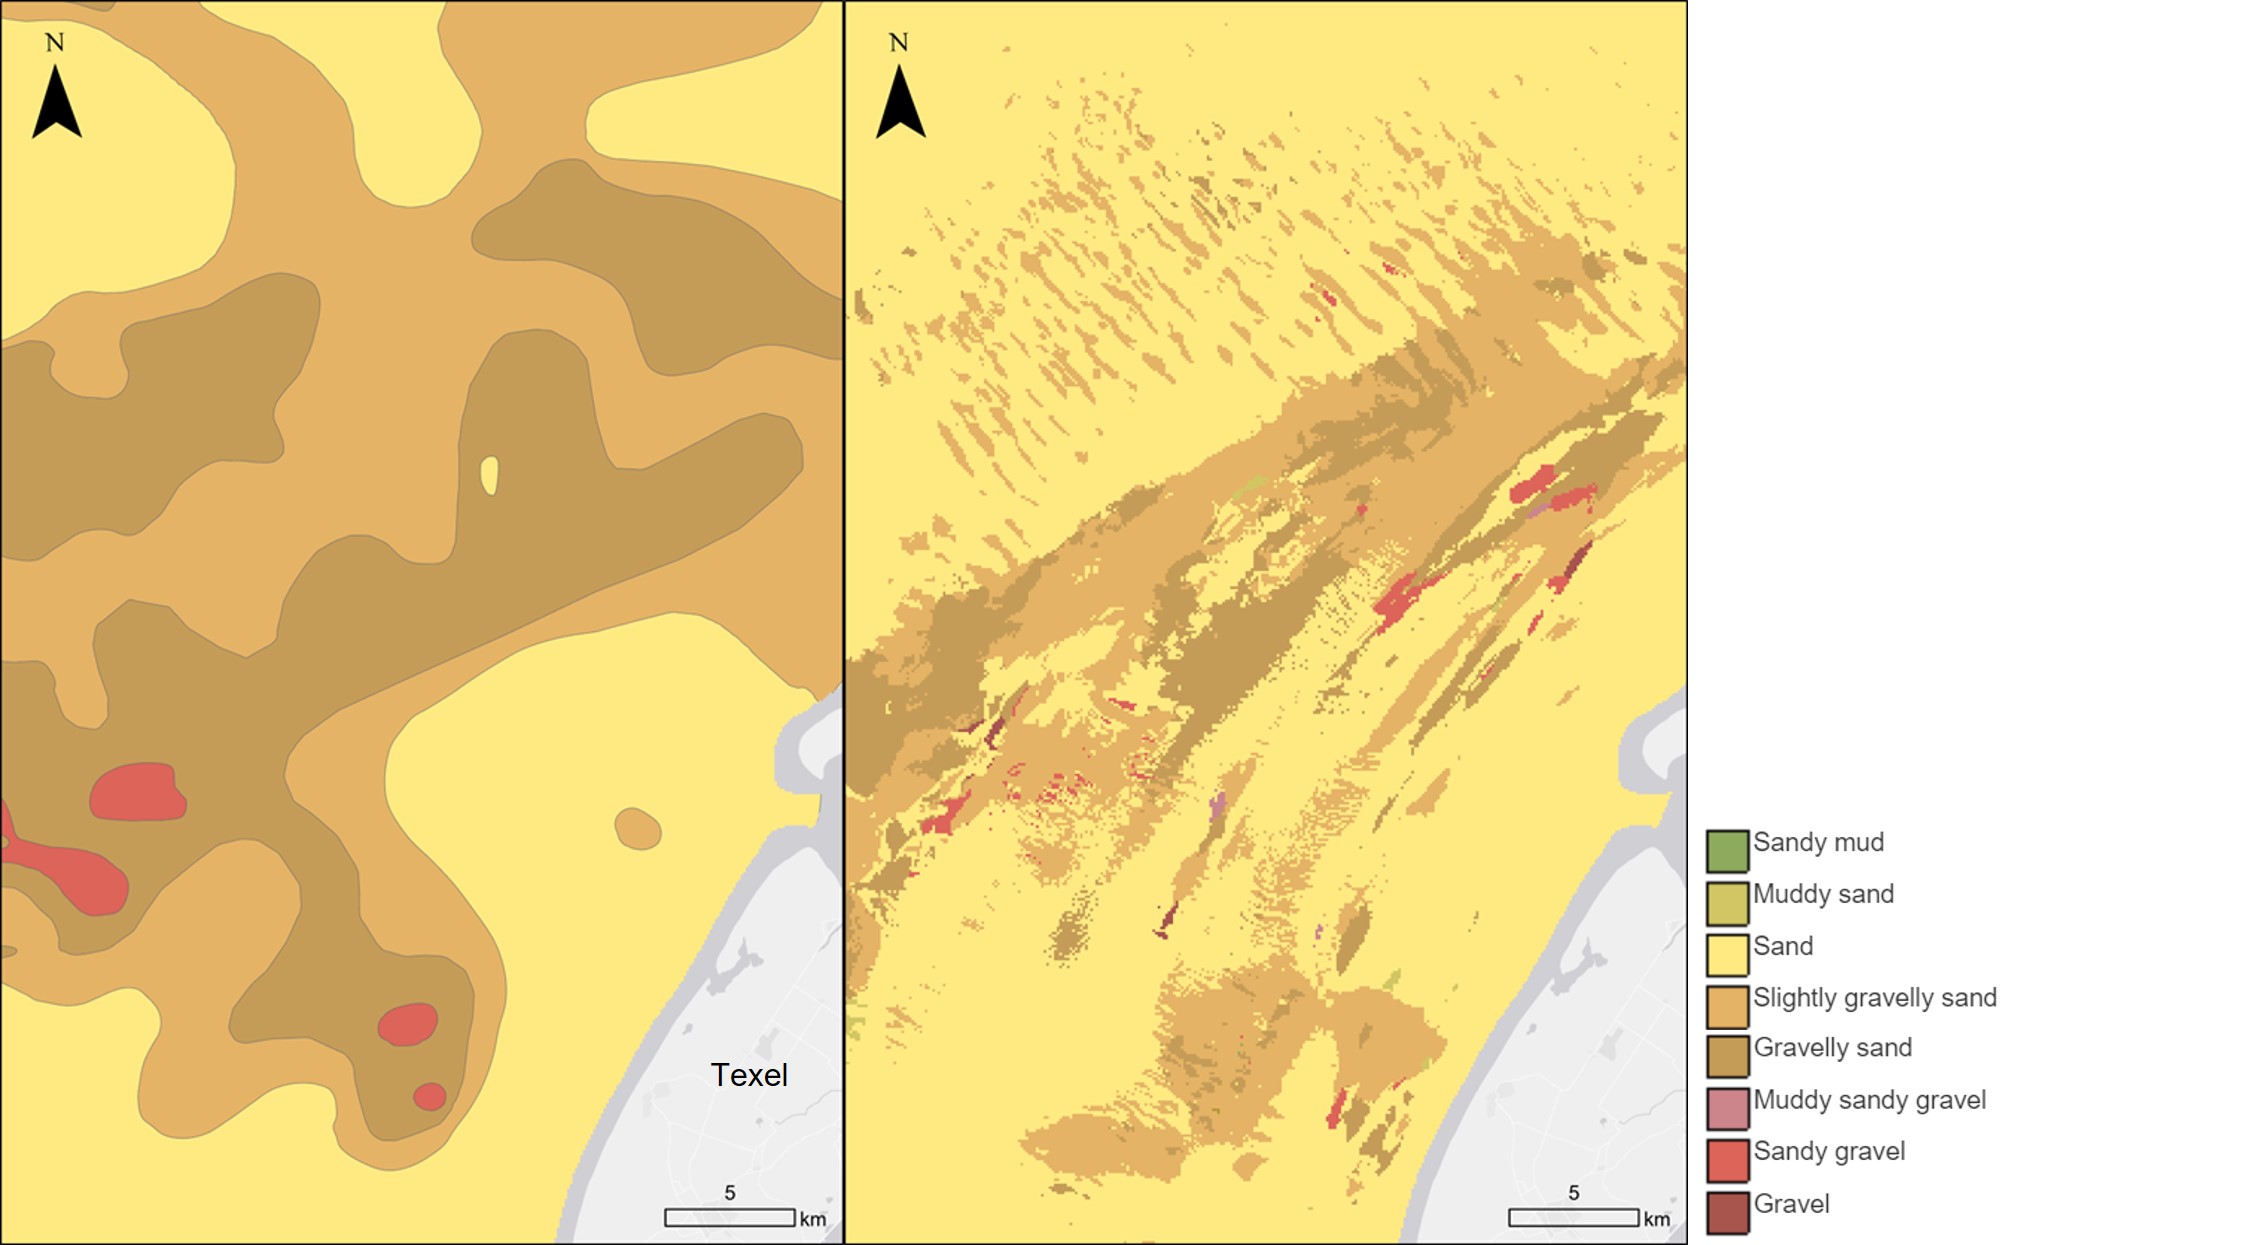 Old and new map views for an area northwest of Texel island.
Source data
Point data used to make the three sediment and uncertainty maps can be optionally projected as small circles. Only about 100 confidential points are not shown. For each of the sample locations represented on the maps, a visual sediment description and/or grain size analysis is available through DINOloket, the repository portal of the Geological Survey of the Netherlands. Folk classes calculated from this information are represented in the same color coding as the sediment maps. The sediment data are a key part of the systematic geological mapping of the North Sea between the late 1970s and 2003, or produced as part of incidental research and commercial projects. Commercial work, commonly along cable or pipeline routes, may have used sampling or description methods that are of lower quality than the uniform standard used in systematic mapping. On the sediment maps, this difference in quality translates into strikingly linear zones where the Folk class differs from that of neighboring areas. On the uncertainty maps, these zones stand out as predictions with a relatively low probability.
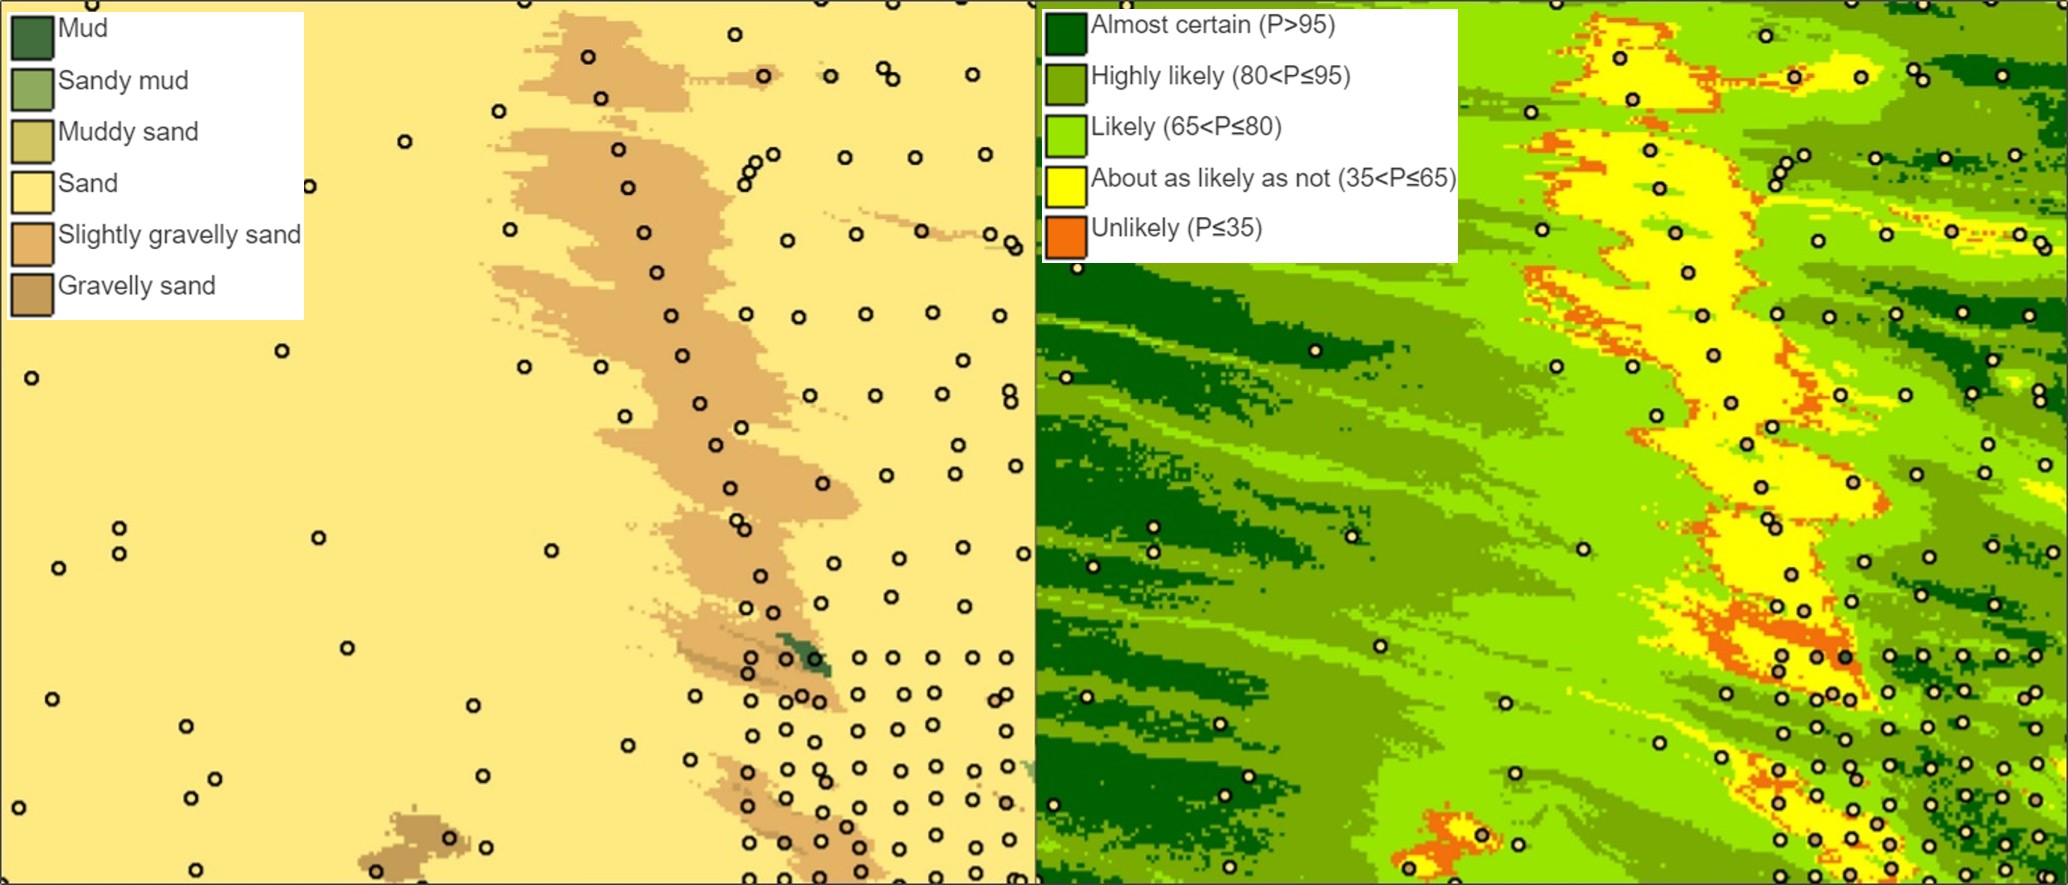 Linear artefact related to a transect of samples described in relatively little detail. They seem relatively coarse (left) but the associated model uncertainty is greater (right).
Method
The random forest algorithm, a machine-learning technique that makes regular updates of the maps feasible and affordable, was used to automate the interpolation of point data from sample locations to full-coverage maps. On the basis of visual sediment descriptions, grain size analyses and bathymetry-derived positional attributes, the most likely sediment type and associated uncertainty were predicted for each 100 by 100 m grid cell. Statistical analysis has been used to quantify the best combination of input variables and interpolation settings. The bathymetric grid used (EMODnet Bathymetry, version 2020) has a resolution of about 115 by 115 m. To avoid edge artefacts, a buffer zone of 10 km was included along the boundary of the Dutch North Sea, making use of publicly available data from external parties (Valerius et al. 2014).
Map application and confidence
The seabed-sediment map is an overview product intended for use at a national or regional scale. With an average sample density of 1 per 4 km2 and a cell size of 100 by 100 m, the formal map scale is 1:200,000 (Tobler 1987). Because of spatial differences in sample density, sediment heterogeneity and quality of the bathymetric grid, this scale is merely indicative. To address issues on a subregional or local scale, information from acoustic studies will be added as part of a future update.
Current and earlier versions
This map is the successor to the Dutch part of a harmonized pan-European seabed sediment map (Kaskela et al. 2019) compiled by collaborating European geological surveys in the framework of EMODnet: the European Marine Observation and Data network. The EMODnet map is based on older, manually created seabed maps that were mostly printed as separate map sheets, and later digitized.
Citation
TNO-GDN (2023) Seabed-sediment map. TNO - Geological Survey of the Netherlands, www.dinoloket.nl/en/subsurface-models; visited on yyyy-mm-dd.
Contact
For downloads, questions or comments, please use our contact form.
References
Folk, R.L. (1954) The distinction between grain size and mineral composition in sedimentary-rock nomenclature. The Journal of Geology 62(4), 344-359.
Kaskela, A.M., Kotilainen, A.T., Alanen, U., Cooper, R., Green, S., Guinan, J., Van Heteren, S., Kihlman, S., Van Lancker, V., Stevenson, A., EMODnet Geology Partners (2019) Picking up the pieces - harmonising and collating seabed substrate data for European maritime areas. Geosciences 9(2), 84.
Tobler, W. (1987) Measuring spatial resolution. Proceedings of the International Workshop on Geographic Information Systems 48, 12-16. International Geographic Union, Commission on Geographical Information Sensing and Processing.
Valerius, J., Van Lancker, V., Van Heteren, S., Leth, J.O., Zeiler, M. (2014) Trans-national database of North Sea sediment data. Data compilation by Federal Maritime and Hydrographic Agency (Germany); Royal Belgian Institute of Natural Sciences (Belgium); TNO (Netherlands) and Geological Survey of Denmark and Greenland (Denmark).