This step enables you to navigate to your area of interest and choose the subsurface data you want to see on the map by means of various filter settings. Use the data shown on the map to request more specific information and visualisation of the graphs.
Content tool bar
In step 1 the following tools are available:
Selected objects: The number of selected objects is displayed. Selection of data occurs in step 2, in step 1 this function is “empty” (0/0.00 MB).
Your Legend: explains the added symbols displayed on the map. The legend is activated by selecting at least one type of data. Click the Your legend button to expand or collapse the legend.
Navigating the map
You can navigate in two ways. These options are both shown top left on the map:- Zoom in and out on the map, using the zoom options (scroll with the mouse, using the zoom bar on the left of the map); move the map (drag with the mouse, or use the navigation wheel on the left of the map).
- Zoom to a specific area. To do so, click on the centre of the navigation wheel to bring up a menu where you can choose the administrative area you want to zoom in on:
- Province
- Water board
- Municipality
- Entire country
- Go to the RD coordinate. To zoom in on the map, type in an x,y coordinate (using the Dutch coordinate system).
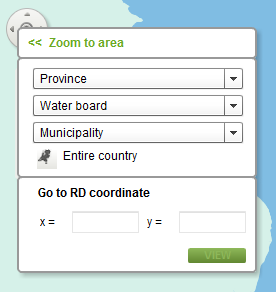
Navigation options: zoom and pan (left panel) or zoom to a predefined area
Go to the specific area. Make your choice from the drop-down menu or click the “Entire country” button to zoom into or out of the map of the selected area. Clicking on << or next to the menu will cause the menu to disappear.
Select the data type of interest
To choose which data you wish to view and wish to order later, use the “Select the data type of interest” menu. It allows you to add information to the map and refine data by applying filters.
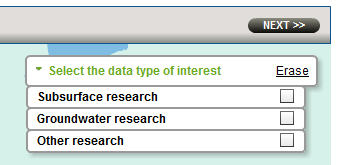
Menu ‘Select the data type of interest’
Select the data type of interest: domain and data types
The selection menu “Select the data type of interest” has a hierarchical structure in which menu items expand and collapse. When you have chosen a domain it is ticked ( ) and at the same time the domain expands and the data types available within it are also ticked. You can tick several domains in one go, but only one domain (e.g. subsurface research) at a time will expand. To turn off the data types within a domain, click on the checkbox. This will then change from into
  At the same time the checkbox in the domain changes from into
  This indicates that the default value “display all” has changed.
The locations of the selected data types are displayed on the map. The symbol next to the category in the data menu corresponds to the symbol on the map.
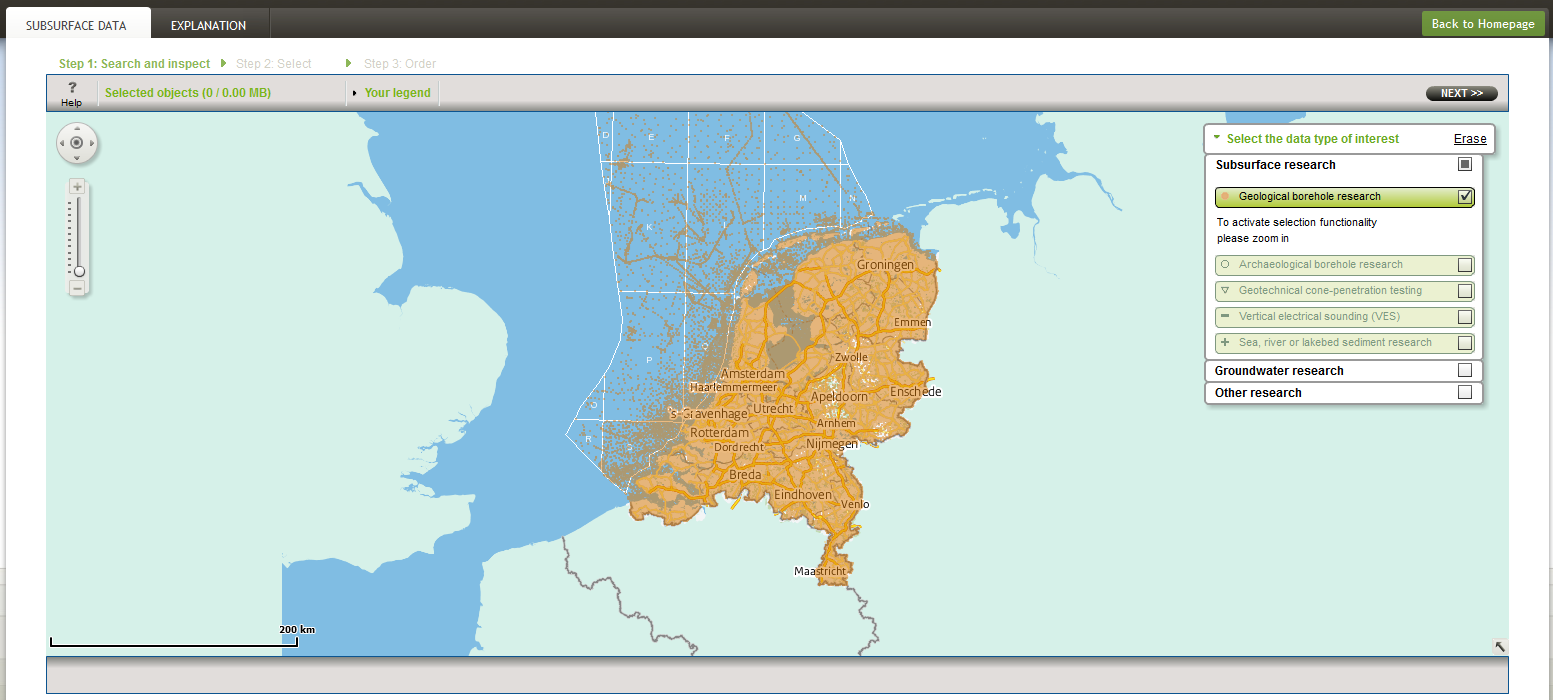
Menu ‘Select the data type of interest’ expanded
Select the data type of interest: specify data types
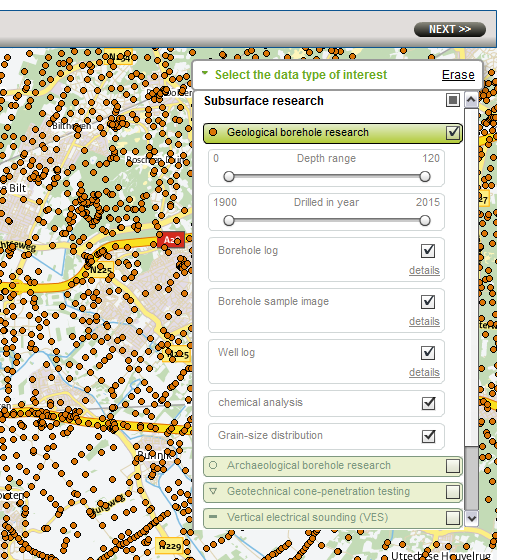
If you zoom in far enough, you can specify the data types further by using the filter settings. These differ with the type of data. If you filter, the checkbox for the data type changes from to (and so does its domain, if this has not already happened as a result of previous choices). Some filter settings allow you to refine your selection by clicking “details” below the checkbox.
The filter settings work like an “or” criterion: on the map, all locations that do not fall within any of the selected filters turn grey.
NB:
- You can filter data by depth. The depth slider in the menu “Select the data type of interest” has a lower limit of 0 m and an upper limit of 120 m. This means that all locations between 0 and 120 metres depth (or deeper) for which data are available are displayed. If you only require data for depths below 20 metres, move the left-hand slide to 20 m. This will remove the locations that only have data up to 20 metres depth. They will remain visible on the map, but will be shown in grey.
- For Groundwater research the lower limit of the slider for the period of monitoring for which data are fully or partly available is set at 1900. The database also contains some data from before 1900. To view these data, set the left-hand slider to 1900 and move the right-hand slider to the left.
Menu ‘Select the data type of interest’: When you have chosen a domain all data types available within it are also ticked
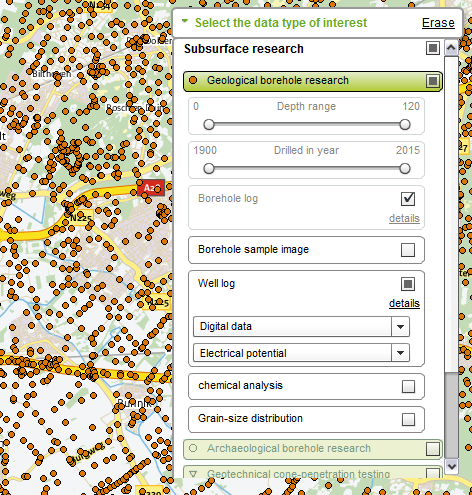
Menu ‘Select the data type of interest’: refine data by applying filters
Detailed information (map option)
Click on an object on the map to retrieve detailed information about it. Two levels of detail are available. Initially you will get a limited overview of the detailed information about the object, in which the main attributes are mentioned.
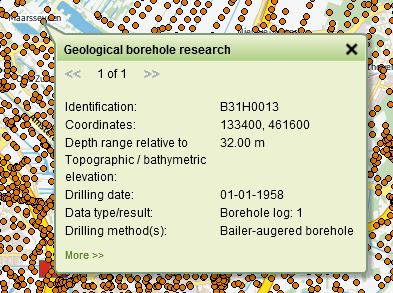
Detailed information about an object shown on the map
Clicking on More >>, will bring up a more comprehensive overview. You can also access the available visualisations of the objects via this overview. The visualisation opens in front of the map. Only after closing the visualisation can you continue searching and viewing the subsurface data on the map.
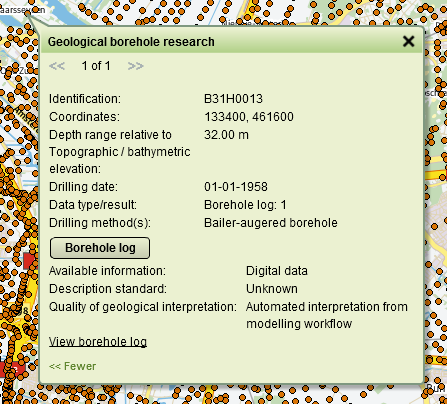
Detailed information: a more comprehensive overview after clicking on More>>
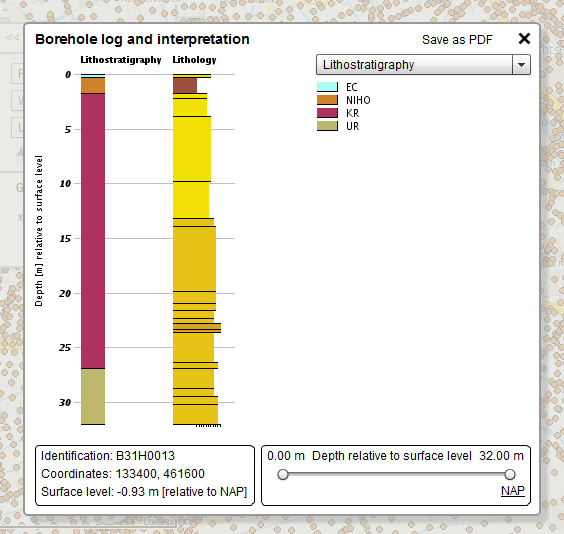
Detailed information: example of a visualisation of an object
Your legend
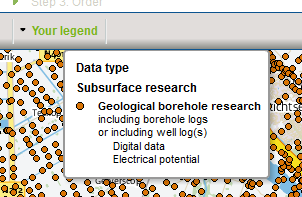
Example of the legend
If you expand the legend (using at least one selected data type) the symbols on the map are explained. The meaning of a symbol is modified in accordance with the settings you selected in the menu “select the data type of interest”. Clicking the button once more will collapse the legend.