In this step you select the data you wish to order by drawing an area on the map using the options in the “Select data”. To view the selected data in tabular form, use the “Show selection” button. You can adjust the selection in this table.
Select data
The objects shown on the map fit the settings that you specified in Step 1. Select the data you want to apply by clicking on the button “Select data” top right of the map screen. The menu can be expanded or collapsed by clicking the triangle. You can use a rectangle or polygon to select data. All data outside the selection will be grey on the map.
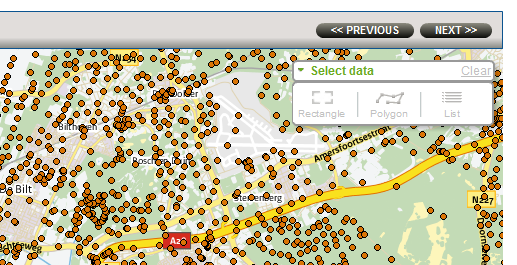
Select the data type of interest
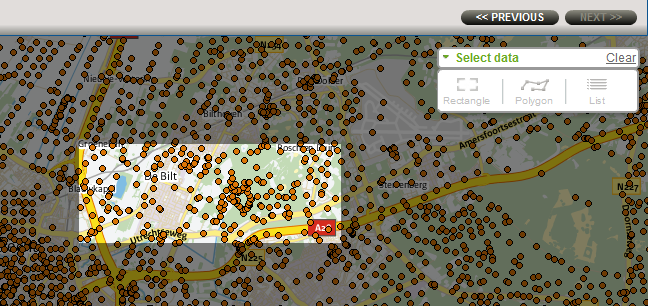
Select objects by drawing a rectangle
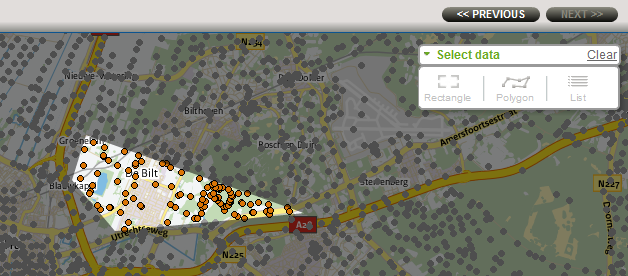
Select objects by drawing a polygon
“Show selection” button
Clicking the “Show selection” button in the “Select data” menu brings up a table with information about the selected objects. All objects that are within your chosen selection area are ticked. If you untick a location that is within the selected area, it will turn grey on the map. The structure of the table is as follows:
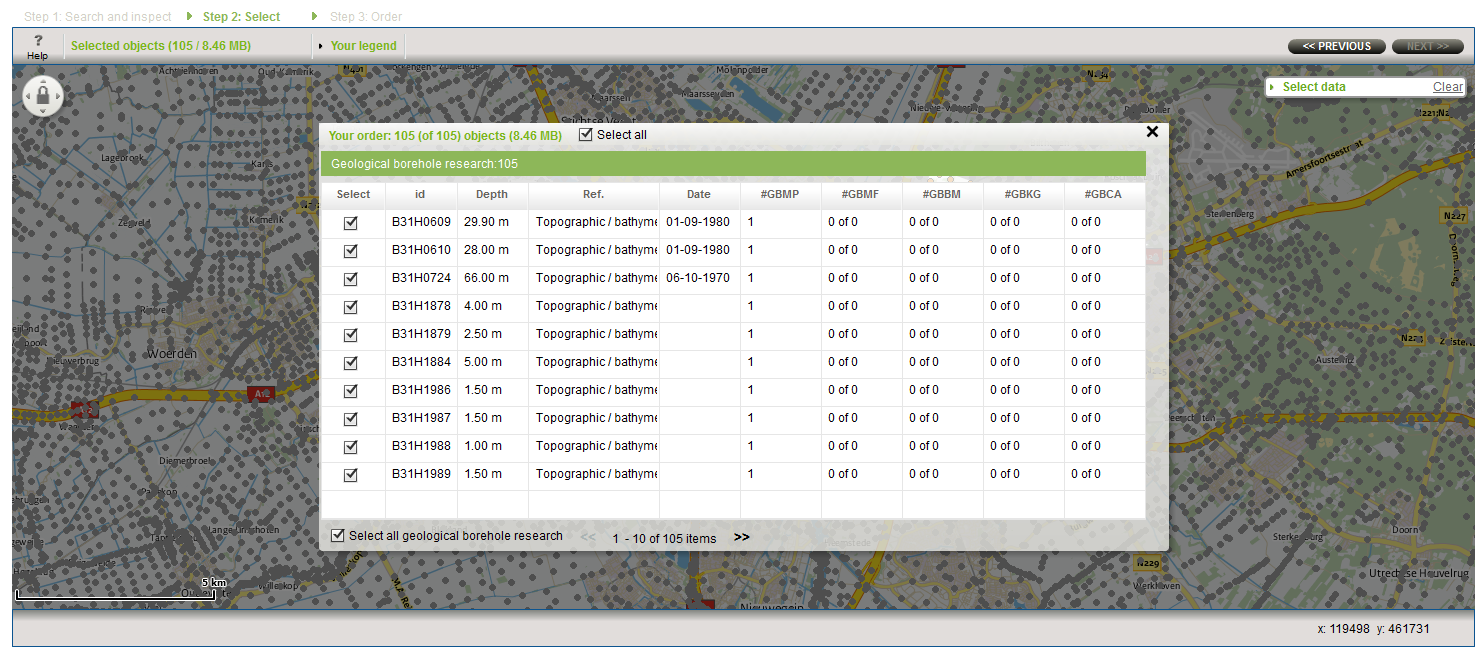
Example of selected objects in table format
Finalising
After you have selected at least one object, use next >> to continue to step 3, to order information on the object(s) selected. NB, do not use the “Back” button on your browser to return to a previous step, as this button takes you back to the Web page you visited prior to the subsurface map.