After selecting your model of interest, a map is created showing the spatial extent of the model and the locations of the boreholes used to generate it.
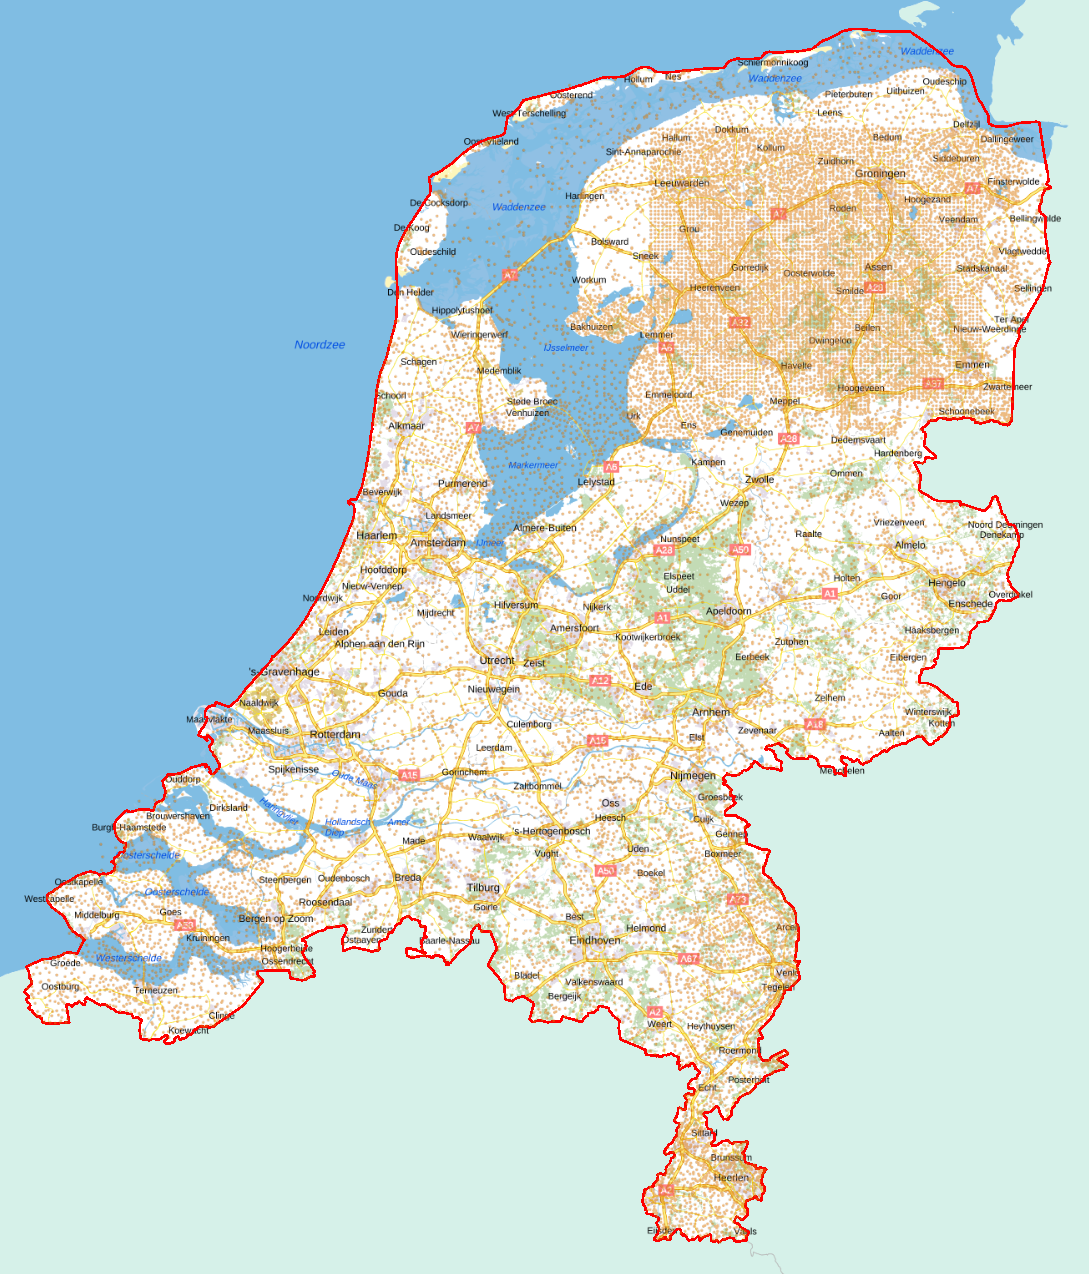
Example of the spatial extent of BRO DGM
A red and blue lines indicate the boundary of the spatial extent. Within these outlines the location of the borehole used to generate the model is shown. Clicking on an individual borehole will bring up the borehole log and additional interpretations.
The boreholes within the red outlines conform to the BRO quality regime.
The borholes within the blue outlines have not been subject to the formal QA and QC procedures designed for the BRO. Therefore, these model areas are “under investigation”, which implies that the obligatory use as well as the obligation to report errors do not apply for government agencies.
Limitations
The boundary of the coverage area is a polygon while the models are grids measuring 100 x 100 m. Therefore, part of the model may fall inside or just outside the polygon. To generate the models we also used confidential boreholes and of borehole data from Utrecht University. These boreholes are not displayed and cannot be ordered at DINOloket.
View
The maps showing the extend of the models are visualised in Step 1.